![]()
|
|
Top Previous Next |
|
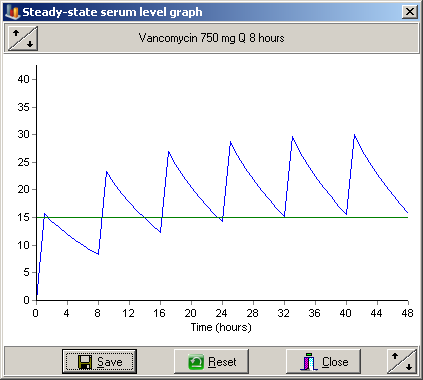
View graph
To view a serum level graph:
Please note: until a dose and interval has been correctly entered, the View Graph option is disabled.
The graph shows the serum level approach to steady-state, including the loading dose or the previous measured level:
Buttons
Save Click Save to have the graph printed on the consult form. Reset Click Reset to reset the graph X,Y scaling to default values. Change Y Scale Click the button in the upper left corner to increase or decrease the scale of the Y axis. Change X Scale Click the button in the lower right corner to increase or decrease the scale of the X axis. Close Click to close the graph window without saving.
|
. ©Copyright 1999 - 2025, by RxKinetics. All rights reserved.