|
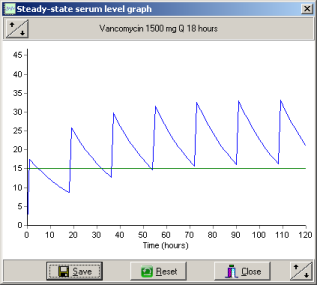
To view a serum level graph:
| • | Click View on the menu bar then click Graph |
| • | Click the View Graph icon on the toolbar |
| • | Or use the keyboard shortcut, Ctrl+G. |
Please note: until a dose and interval has been correctly entered, the View Graph button is disabled.
|
Note: If you wish to have a serum level graph printed on your dosing consult, click the Save button.
Graph scale
The serum level graph may be re-scaled by clicking on the arrow buttons in the upper left and lower right:
| • | Top left (Y-axis) |
| • | Bottom right (X-axis). |
Click the Reset button to return to default scaling.
EI nomogram graph
The EI nomogram is displayed when utilizing the Extended interval method for aminoglycosides.
Interval break points are labeled and the measured level is show in red.
|
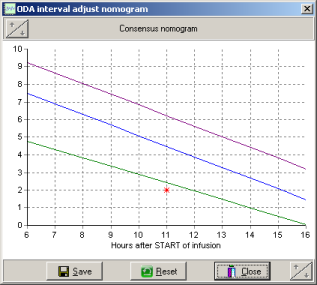
Graph scaling is disabled with the EI nomogram.