Bayesian Schmayesian

The revised vancomycin guidelines are currently in the comment phase, and peaks are cool again. With two levels a Bayesian algorithm is not required, the calculations can easily be done the old fashioned way. How did we do kinetics back in the seventies, before desktop PC’s? The answer: 3-cycle semi-log graph paper, get yours here

Computer-less AUC-guided dosing

  1. Ensure no vacomycin on board, then give a 20mg/kg load.
  2. Draw a post-distribution level (1 to 2 hours after the end of the infusion).
  3. Calculate the creatinine clearance in order to estimate the vancomycin half-life (see table below).
  4. Draw a vancomycin level at the estimated half-life.
  5. Plot the results and connect the dots (see the idealized example below).
  6. The half-life is the time it takes for the serum level to drop by half.
  7. Calculate the elimination rate from this known relationship: Kel = 0.693 / Half-life
  8. Estimate the volume of distribution from this basic pk equation: Vd = Dose/Peak

How to estimate vancomycin half-life

CrClHalf-life (hrs)
140 6
1008
7012
5016
3524
2532
< 25pulse dosing (?)

An idealized example

Using the pk parameters derived from the semi-log plot we can then estimate the dose required to reach a target 24-hr AUC by using the known relationships between pk terms:
Clearance = Kel * Vd (L/hr)
24-hr AUC = Daily dose/Clearance (mg*hr/L)
= (Dose * (24 / Interval)) / (Kel * Vd)

Ideally we re-dose vancomycin at the half-life, rounded for practicality

The target range for 24-hr AUC is 400 to 550, therefore the initial target would be the midpoint: 475.
Dose = (475 * Kel * Vd) / (24 / Interval)
From the above example:
Dose = (475 * 0.058 * 50) / (24 / 12)
= 686 mg

Round to a practical dose and recheck your 24-hr AUC output.
From the above example, round to 750mg:
24-hr AUC = (Dose * (24 / Interval)) / (Kel * Vd)
= (750 * ( 24 / 12)) / (0.058 * 50)
= 519 mg*hr/L

Finally, estimate the steady-state trough using the standard pk equation:
Css(trough) = Css(peak) * e -kel*tau
From the above example.
Trough = 15.5 mg/L

Understand the limitations

Please realize that vancomycin kinetics are multi-compartmental. The one-compartment model does not capture the distribution phase(s) thus it under-estimates the true 24-hr AUC by 5 to 10%. What does this mean in practice? First, if the calculated 1-compartment AUC is 400, then you can be assured that you have hit the minimum 24-hr AUC target. Second, if your estimated 24-hr AUC is greater than 550 then the dose is likely to be above the AKI risk threshold.

Enjoy.

AUC Guided Dosing of Vancomcyin

Practical application of PK/PD principles

Integrating the MIC with the PK parameters peak, trough and AUC results in three PD targets for antibiotics

The dose-response curve is an underlying principle of pharmacology and pharmacodynamics. Once the target is met, a plateau is reached. Higher doses will not result in more rapid killing. In fact, as we will see, larger doses often lead to adverse effects.

What was missed by many is the fact that the 2009 vancomycin consensus guidelines established the 24-hr AUC/MIC ratio as the therapeutic target. The trough goal of 15 to 20 mg/L was chosen as a surrogate marker for the true pharmacodynamic target, the AUC/MIC ratio.

There is a good deal of evidence that AUC/MIC ratio is the proper target for vancomycin dosing. The slide below is from a study of a mouse model of soft-tissue MRSA infection. Above the dotted line there is no inhibition. Below the dotted line there is increasing inhibition. Time Above MIC and Peak/MIC ratio are scatter plots. Looking at 24-hr AUC/MIC ratio a well defined pattern can be seen. At 100 or less there is no inhibition. At 200, most colonies are inhibited. At 400 or greater all colonies are inhibited. It is important to note that the higher ratio of 1000 did not result in more colonies inhibited. In other words, a response plateau was seen at 400.

Numerous clinical studies have also established the suitability of the AUC/MIC ratio in predicting therapeutic efficacy.

After the 2009 guidelines advocating higher trough levels came into widespread practice, the number of published reports of vancomycin associated nephrotoxicity skyrocketed.

On the other hand, it has been clearly shown that a continuous infusion of vancomcyin, targeting a constant 20 to 25 mg/L, is less nephrotoxic than intermittent dosing targeting troughs of 15 to 20 mg/L. This apparent contradiction can be explained if we attribute the risk of nephrotoxicity to AUC, just as we do for efficacy.

What is the AUC threshold for vancomycin associated AKI? The most often cited number in the literature is 600. In 2017 Chavada, et al. sought to answer this question. Theirs was a six year study of patients with bacteremia. They used a 1-compartment model, with AUC calculated from Bayesian analysis of a steady-state trough. They found that AKI risk more than doubled when the AUC exceeded 563.

The most widely used pharmacokinetic model for vancomycin is one-compartment. The equations for a one-compartment model are practical and time-tested. Because vancomycin exhibits a multi-compartment pharmacokinetic profile, the clinical application of the one-compartment model requires post-distribution serum samples. Also realize that the one-compartment model does not capture the distribution phase(s), and thus underestimates true peak by approximately 5 to 10 percent.

It is important to be cognizant of this AUC underestimation for two reasons. One, if the AUC calculated by our one-compartment model is 400, then you can be sure that you have hit the minimum AUC target. It follows that the maximum AUC should be less than 600. The study cited above by Chavada, which used a one-compartment model, found the AKI threshold to be 563, which is 6.1% less than 600.

Therefore, a safe and effective target AUC range for our one-compartment vancomycin model should be 400 to 550.

Analysis of Targeted AUC Dosing

Recent evidence regarding vancomycin pharmacokinetics/pharmacodynamics has initiated a paradigm shift in vancomycin dosing from targeting trough concentrations to area under the concentration-time curve (AUC), specifically the 24-hr-AUC/MIC ratio.

Compelling clinical data suggests that targeting a vancomycin 24-hr-AUC/MIC ratio of at least 400 mg · h/liter will ensure efficacy. The 2009 consensus committee on vancomycin TDM made the assertion that the vancomycin trough level is a good surrogate for the AUC, because in most adult patients a steady-state trough concentration of 15 to 20 mg/liter correlates with a 24-hr-AUC/MIC ratio of at least 400 for an organism with an MIC of 1 mg/liter or less.

Since the implementation of the vancomycin consensus guidelines, several studies have documented a higher incidence of nephrotoxicity associated with the more aggressive trough goal. In contrast, a large meta-analysis suggested that a continuous infusion targeting a constant vancomycin concentration of 25 mg/liter is less nephrotoxic than standard intermittent dosing. This can be explained if we attribute the risk of vancomycin nephrotoxicity to the AUC, just as we do for efficacy.

To date the AUC threshold for vancomycin nephrotoxicity has not been clearly defined, 600 to 700 has been suggested. The goal of Chavada et al was to define the upper limit of the vancomycin AUC range. They found that a vancomycin 24hr-AUC of greater than 563 mg · h/liter was associated with significantly increased risk of AKI.

One of the features of APK that I am most proud of is the population analysis tool. Each time you save a consult based on serum level analysis, the pk parameters are saved. This data set is a goldmine of information about your patient population.

The data set presented below is from 1,671 adult general med-surg patients, with 1,078 in the subgroup of BMI less than 30. The vanocomyin pk model used for Bayesian analysis of this subgroup is similar to that used by Chavada.


Patient demographics
Total=1078, F=486, M=592
Ave
Min
Max
Age (years)
61.6
19
99
Weight (kg)
68.1
35.7
114.2
SrCr (mg %)
0.87
0.3
4.8
CrCl (ml/min)
55.7
10
120
Vd (L/kg)
0.72
0.62
0.83
Half-life (hours)
9.2
3.5
46.2

The patient specific pk parameters from this data set were then used to determine a dosing regimen based on either a target trough goal of 15 to 20 or a target AUC goal of 400 to 563. Dosing intervals were based on half-life and converted to a more practical 6, 8, 12, 18, 24 or 48 hours. Doses required to achieve the therapeutic goal were rounded to nearest 250mg whenever possible.

Assuming an MIC of 1 or less, the minimum target AUC was determined to be 400. The upper limit of AUC was set to 563, as determined by Chavada. This target range is displayed within the shaded area in the figures below.

Targeted trough dosing
Doses required in this group ranged from 400 to 2000mg. As we often see in clinical practice, a significant number of regimens (91) did not achieve a trough of 15 within what is considered a safe dose range.

All dosage regimens in the targeted trough group achieved an AUC of at least 400, which confirms the goal of the 2009 guidelines. However, the majority of these doses, 597/1078 (55%), resulted in an AUC above the likely AKI risk threshold.

Targeted AUC dosing
Doses required to achieve the target AUC ranged from 400 to 1500mg.

All dosage regimens in the targeted AUC group also achieved an AUC of 400. No doses resulted in an AUC above the AKI risk threshold. This analysis also confirms previously reported studies which found that, in the majority of patients, an AUC of 400 can be achieved with a trough less than 15. In this analysis, 77% of dosing regimens (831/1078) achieved the AUC goal with a trough less than 15.

Although controversy remains regarding whether vancomycin has a direct toxic effect, vancomycin-associated nephrotoxicity has been linked to troughs greater than 15. Targeted AUC dosing of vancomycin would be expected to reduce unnecessarily high exposure and thus reduce nephrotoxicity.

Reference
Chavada R, Ghosh N, Sandaradura I, Maley M, Van H. Establishment of an AUC0–24 threshold for nephrotoxicity is a step towards individualized vancomycin dosing for methicillin-resistant Staphylococcus aureus bacteremia. Antimicrob Agents Chemother 61 (5). 2017 Apr 24.

Targeted AUC Dosing

The 24-hr AUC/MIC ratio

The trough level is but a surrogate marker for the true pharmacodynamic parameter for vancomcyin, the 24-hr AUC/MIC ratio. The target vancomycin trough level of 15-20 mg/liter was chosen in the 2009 vancomycin TDM guidelines to maximize the likelihood of achieving a 24-hr AUC/MIC ratio of >400 mg·h/liter.

Targeting the trough level has been criticized as trough concentrations underestimate the true AUC by 25% on average. Recent pharmacokinetic data suggest that the majority of patients can achieve AUC values of >400 with trough concentrations less than 15.

Although controversy remains regarding whether vancomycin has a direct toxic effect, vancomycin-associated nephrotoxicity has been linked to troughs greater than 15. Monitoring vancomycin by AUC would be expected to reduce unnecessarily high exposure and thus reduce nephrotoxicity.

Although clinical data suggest that targeting the daily vancomycin AUC above 400 will ensure efficacy, the AUC range associated with nephrotoxicity has not been clearly defined. Based on current data, it appears prudent to maintain the AUC below 600 (and trough below 20).

PK software

Since 2004 all of RxKinetics PK software has performed PK/PD parameter calculations. Unfortunately this feature was hidden behind a button in APK and AbPK. It makes me wonder how many folks using the software have missed this feature.

With that in mind, I’ve moved the AUC calculation in APK up front. No longer hiding behind a button, AUC is displayed along with the predicted peak and trough levels.

In addition, a Targeted AUC dialog has been added. This new dialog is accessed via the Tools menu.

The Targeted AUC dosing dialog does precisely what the name implies. Enter a target AUC and an ideal dose is calculated. This isn’t rocket science. The ideal interval is the half-life plus infusion time (usually one hour), plus distribution time (one hour). Ideal dose is then calculated with the AUC equation rearranged to solve for dose. After entering a practical dose and interval, the predicted 24-hr AUC, peak, and trough are displayed.

The PK/PD dialog remains unchanged, and is (still) accessed by the PK/PD button (or via the Tools menu).

Click Save on this dialog to copy the appropriate pharmacodynamic parameter. As detailed above, the 24-hr AUC/MIC ratio is the most useful parameter for vancomycin. For aminoglycosides, the peak/MIC ratio is the best predictor of efficacy.

Recommended reading

  1. Zasowski E, Murray K, Trinh T, Finch N, Pogue J, Mynatt R, Rybak M. Identification of Vancomycin Exposure-Toxicity Thresholds in Hospitalized Patients Receiving Intravenous Vancomycin. Antimicrob Agents Chemother. 2017 Dec 21;62(1).
  2. Chavada R, Ghosh N, Sandaradura I, Maley M, Van H. Establishment of an AUC0–24 threshold for nephrotoxicity is a step towards individualized vancomycin dosing for methicillin-resistant Staphylococcus aureus bacteremia. Antimicrob Agents Chemother 61 (5). 2017 Apr 24.
  3. Pai M, Neely M, Rodvold K, Lodise T. Innovative approaches to optimizing the delivery of vancomycin in individual patients. Adv Drug Deliv Rev. 2014 Nov 20;77:50-7.
  4. Andrew DeRyke, C & P. Alexander, Donald. Optimizing Vancomycin Dosing Through Pharmacodynamic Assessment Targeting Area Under the Concentration-Time Curve/Minimum Inhibitory Concentration. Hospital Pharmacy. 2009 44. 751-765.

Data Mining

Users of rxkinetics.net have been contributing to a large data set for the past three years. The web app has been saving anonymous data from serum level analysis during this time. See this blog post: The BBVM project part II.

It is important to state up front that there is no quality control over this anonymous data. Some of it could have been entered incorrectly. Also there is no way to know how much is real patient data versus someone experimenting with the web app.

The other problem with this type of data collection is that many don’t “run the numbers” when the results are within target range. Therefore, outliers tend to become more prominent in the data set.

With those caveats in mind, let’s examine the data.

All BMI < 19 BMI 19-30 BMI > 30
Total 2937 180 1808 939
Male 1686 89 1074 523
Female 1251 91 734 416

Let’s delve into the statistics from the two largest groups.

BMI 19-30

Descriptive stats

Age BMI CrCl Vd L/kg TBW VD L/kg ABW
Min 15 19.04 8.0 0.38 0.38
Max 100 30.04 120 0.92 1.21
Mean 60.6 24.8 77.3 0.67 0.72
Median 63 24.6 72.0 0.69 0.73
Mode 65 23.2 120 0.70 0.70
S.D. 18.48 2.96 30.97 0.09 0.11

The raw Vd histogram follows a normal distribution (as a large sample should).
Vd_Raw

But the histogram for Vd L/kg total body weight (TBW) has a noticeable negative (left) skew.
Vd_TBW

Because Vancomycin does not distribute well into adipose tissue let’s look at Vd L/kg of adjusted body weight (ABW), where ABW = LBW + 40% of the difference between TBW and LBW (i.e., the weight we used to dose Vancomycin “back in the old days”).
Vd_Adj_BW

The histogram of Vd L/kg ABW is noticeably more normal than TBW (but not ideal).

Regression of CL vs CrCl results in a higher r^2 value when we use Normalized CrCl vs LBW-based CrCl, 0.528 vs 0.524. (CrCl Methods explained)
Clearance_vs_LBW_CrCl

Clearance_vs_NormCrCl

BMI > 30

Descriptive stats

Age BMI CrCl Vd L/kg TBW VD L/kg ABW
Min 17 30.1 10 0.37 0.45
Max 95 77.7 120 0.91 1.40
Mean 59.2 37.9 73.6 0.67 0.89
Median 60 35.4 71 0.69 0.89
Mode 57 32.4 120 0.70 0.59
S.D. 15.59 8.08 30.41 0.11 0.16

As with the previous group, in obese patients the histogram for Vd L/kg of ABW has a more normal distribution than TBW.

Large_Vd_Raw

Large_Vd_TBW

Large_Vd_ABW

The r^2 improvement is even greater in obese patients when using normalized CrCl for the Kel regression, 0.533 vs 0.412.

Large_Clearance_vs_LBW_CrCl

Large_Clearance_vs_NormCrCl

Summary
Again, since the data is not verified this analysis is debatable. However it does pose a couple of questions:

  • Should we use adjusted body weight when modeling Vancomycin volume of distribution?
  • Should we use normalized creatinine clearance when modeling Vancomycin elimination rate?

Complex non-steady-state analysis

This is a feature that I have wanted to add to my PK programs for quite sometime. In the real world doses don’t get hung on time and dosages get changed before levels are drawn.

Complex is the keyword. This was incredibly complex to code, both the logic of data entry and analysis. It has taken weeks of intense work to complete. Currently in the testing phase, I hope to bring it to production soon.
Complex_nonSS

When you select “Complex non-steady-state analysis” the program displays two grids, one for entering doses and the other for serum levels.
Complex_nonSS_data
You may enter up to five doses of various amounts, given at different rates and at different times. You may enter up to two serum levels. Of course there are limitations (which the data entry routines catch). For example, you cannot enter a date/time for a level that conflicts with a dose date/time.

If the first serum level is drawn before the first dose it will be considered a baseline level. This is also something that I have wanted to add for years. It will be most useful when performing a follow-up pk consult on a long-term patient.

Another feature added from my to-do list is the ability to select an infusion rate for your recommended dose.
complex_recommend

You will still see Bayesian fails. This new data entry methodology will not prevent them from happening. That is the nature of Bayesian and the highly variable nature of Vancomycin kinetics.

Even people who have used my programs for years fail to comprehend what Bayesian analysis involves. The first thing to realize is that Bayesian analysis begins with your population model. It then attempts to fit your measured levels to incremental variations of your population model. In classic Bayesian, if the data cannot be fitted to the model within reasonable statistical limits, then the data is thrown out. I do not believe that rule should be applied to clinical pharmacokinetics. So I leave it up to you to decide how to proceed by showing the “Bayesian analysis failed” dialog.
Complex_fail
Essentially this dialog is telling you that your measured level differs too much from the model predicted level. You can find out what level the population model predicted by visiting the prospective tab. If you measured 6 but the model predicted 24, then never the twain shall meet. Either (1) you have chosen the wrong model for your patient, or (2) the measured level is wrong. That is your decision, not one to be made by a computer program, period.

KinPlot Update

Pulled an all nighter to update both the Windows and the Web versions of KinPlot. This is a simple tool for learning pharmacokinetic concepts by depicting the effects that various pk parameters have on serum levels, leading to a better understanding of drug regimen design.

I had a request for IV push modeling from a Cornell professor. The simplest solution was to utilize a 6 minute infusion to approximate IV push administration (the math is easier with decimals, i.e., 6 min = 0.1 hr).

Since they use Macs I needed to update the Web App as well.
KinPlot_web

Web version here.

The Windows version adds a few more bells and whistles: the ability to model oral pk and to save/load graphs.
kinplot_win_23

Windows version here.

Enjoy.

APK 3.1.20

I’ve spent much of my ‘free’ time during the last month been pouring over error reports received during the past year. Unfortunately most of the reports are vague and completely untraceable as to their cause. Focusing on the most commonly reported errors I’ve tried to deduce their causes, but I’m likely to be completely off base.

TfrmMain, TfrmPrint: EConvertError

‘Not a valid floating point value’. All of these error reports came from version .18. This was fixed in version .19 by changing all calls to StrToFloat to TryStrToFloat. Come on folks, updates are free, please keep your copies up-to-date.

TfrmMain: Range check error
There were several Range errors which I believe originate in the Topaz database engine (no trace available). I re-compiled Topaz with Range checking turned off, hopefully that will tone down the frequency of these error reports.

TfrmPrint: Multiple errors

Multiple errors were reported originating in the TfrmPrint class. Procedures flagged include: SaveConsult, SaveLevels, SavePatient, ValidPatData, GraphPrep, and ReDrawSerumLevelPlot. Hopefully recompiling Topaz will fix most of the Save errors. But, to add another layer of safety, I’ve added try..try..except..finally blocks to each procedure and changed the SerumLevel array from fixed to dynamic.

TfrmMonitor: No default printer selected
This was reported twice. I cannot imagine how or why someone would not have a default printer selected in Windows. Regardless, I’ve added this tiny bit of code to hopefully catch that condition (unfortunately I have no way of testing this):
if (Printer.PrinterIndex > 0)then
begin
// Print the consult
end;

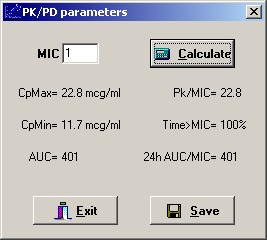
TfrmPKPD: Division by Zero
The function AUC was flagged in one report. I cannot imagine how this procedure gets called without valid parameters, but, once again, I added try..try..except..finally block that will prevent the program from crashing.

TfrmLevels; EConvertError
‘is not a valid integer value.’ Sounding like a broken record, I simply cannot imagine how this procedure gets called without valid parameters, regardless I changed StrToInt to TryStrToInt in hopes of fixing this impossible error.

TfrmMain: Pack date invalid
This error came up twice, with no traceable cause. Because the user is able to change date settings in Windows at will, I assumed an incompatible date format is causing the issue. I added some code to force the short date format into the standard USA: ‘MM/dd/yyyy’. Originally I had declared the OutputBuffer within the var block of the function, but that was causing a memory leak on exit, even after adding a StrDispose in the cleanup (finally) block:
procedure TfrmMain.SavePackDate();
var
APKini : TIniFile;
strDateFormat : string;
strTemp : string;
OutputBuffer: PChar;
SelectedLCID: LCID;
begin
try
// Determine local short date format
OutputBuffer := StrAlloc(255);
SelectedLCID := GetUserDefaultLCID;
GetLocaleInfo(SelectedLCID, LOCALE_SSHORTDATE, OutputBuffer, 255);
strTemp := string(OutputBuffer);
// if first letter is d then set to 'dd/MM/yyyy' else 'MM/dd/yyyy'
if Copy(strTemp, 1, 1) = 'd' then
strDateFormat := 'dd/MM/yyyy'
else
strDateFormat := 'MM/dd/yyyy';
try
APKini := TIniFile.Create(PathName + 'apk.ini');
try
APKini.WriteString('dbMaint', 'Pack date', FormatDateTime(strDateFormat, Now));
finally
APKini.Free;
end;
except
on E:Exception do begin
MessageDlg('Error saving pack date',
E.Message,
mtError, [mbOK], 690, dckActiveForm);
end;
end;
finally
// Free up the string list memory
StrDispose(OutputBuffer);
end;
end;

After I moved the code into an inline function there were no more memory leaks:
procedure TfrmMain.SavePackDate();
var
APKini : TIniFile;
strDateFormat : string;
strTemp : string;
function ShortDateFormat: string;
var
OutputBuffer: array[0..255] of Char;
SelectedLCID: LCID;
begin
SelectedLCID := GetUserDefaultLCID;
GetLocaleInfo(SelectedLCID, LOCALE_SSHORTDATE, OutputBuffer, 255);
Result := OutputBuffer;
end;
begin
try
// Determine local short date format
strTemp := ShortDateFormat;
// if first letter is d then set to 'dd/MM/yyyy' else 'MM/dd/yyyy'
if Copy(strTemp, 1, 1) = 'd' then
strDateFormat := 'dd/MM/yyyy'
else
strDateFormat := 'MM/dd/yyyy';
APKini := TIniFile.Create(PathName + 'apk.ini');
try
APKini.WriteString('dbMaint', 'Pack date', FormatDateTime(strDateFormat, Now));
finally
APKini.Free;
end;
except
on E:Exception do begin
MessageDlg('Error saving pack date',
E.Message,
mtError, [mbOK], 690, dckActiveForm);
end;
end;
end;

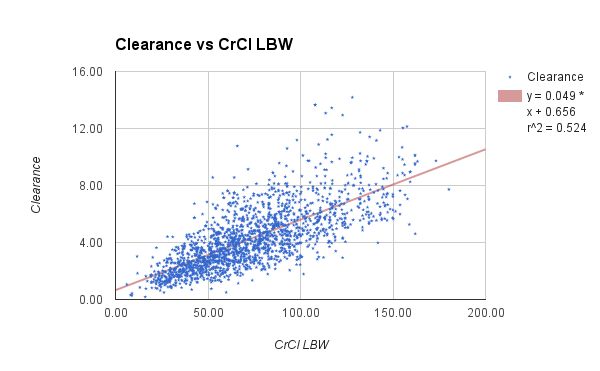
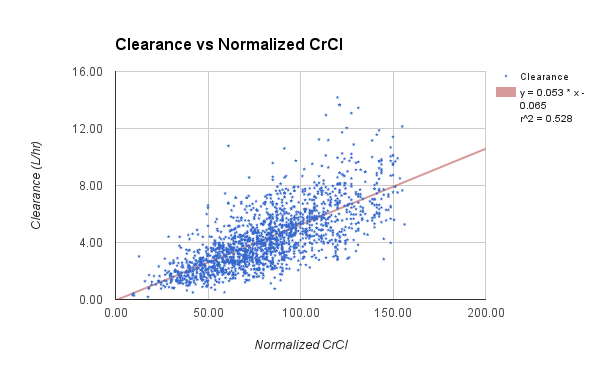
Population analysis improvements
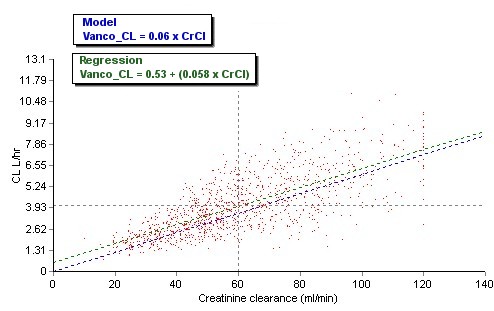
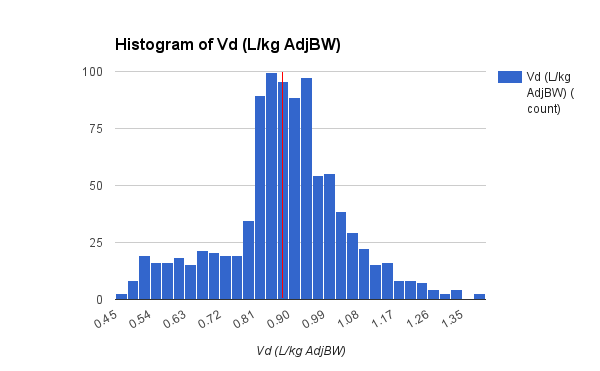
I did find some time to make several improvements in this version of APK. The main focus of improvements this go round is the population analysis function. Probably the biggest change is removal of the 500 record limit, it now uses dynamic arrays so the number of records that may be analyzed is virtually unlimited. I added text to display the current model for comparison to the population analysis and a regression line of the current Kel or CL calculation.

apk_analysis_report

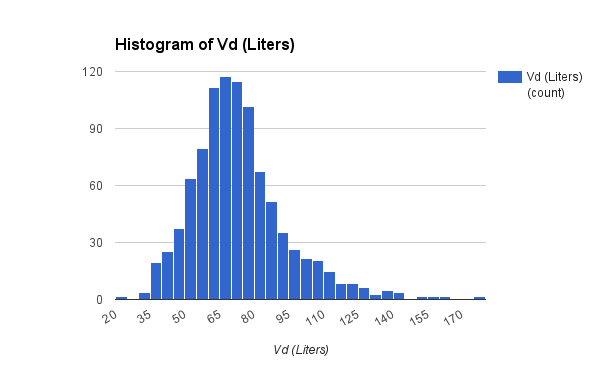
APK Population Analysis Report

Finally, I added a median Vd calculation, which is surprisingly complex:

function MedianVd: double;
var
n,i,middle : integer;
TempDouble : double;
TempArray : array of Double;
begin
// Set Length of TempArray
SetLength(TempArray,TotalPatients);
// Copy first column of RegressTable array
for i := 0 to TotalForArray do begin
TempArray[i] := RegressTable[i,0];
end;
// use truncated selection sort to find median
middle := (TotalForArray+1) div 2;
for i := 0 to middle do begin
for n := 1 to TotalForArray-i do begin
if TempArray[n] > TempArray[n-1] then
begin
TempDouble := TempArray[n];
TempArray[n] := TempArray[n-1];
TempArray[n-1] := TempDouble
end
end
end;
// find median
try
if odd(high(TempArray)) then
// when high(TempArray) is odd, there are an even number of elements in array.
// define median as average of two middle values.
result := (TempArray[middle] + TempArray[middle-1]) / 2
else
// when high(TempArray) is even, there are an odd number of elements in array.
// median is the middle value.
result := TempArray[middle];
finally
// Free memory used for TempArray
SetLength(TempArray,0);
end;
end;

As soon as I finish testing I will release this version into the wild. Enjoy.

And here’s my current favorite song (based on a true story), “Who’s the judge to decide how much this world should punish”:

FreeKin update

It’s a FreeKin update yo’.

I can’t believe it’s been 12 years since I wrote this FreeKin modeler program. It was originally written in Delphi 5, which I no longer have installed on my PC. However, I was pleasantly surprised when Delphi XE2 imported it without a hitch.

I made a few FreeKin tweaks here and there:

  • Increased the size of the fonts and the dialogs.
  • Added a save to xls function.
  • Improved the report function.
  • Wrote a new help file (RTFM).
  • Miscellaneous improvements to the interface flow.

I doubt if anyone else has ever used this FreeKin modeler program, but I love it. Not just for the double entendre name, but also for the simplicity and no nonsense practicality.

Enjoy FreeKin, I do!

Main FreeKin Screen

Main FreeKin Screen

What’s old is new again

There was an excellent session at the Midyear entitled “Infectious Diseases Update: Using Guidelines to Optimize Treatment”. Dr. Michael Ryback spoke about the “Implications of the Vancomycin Consensus Guidelines”. He pointed out the shortcomings of the 2009 guidelines, specifically those patient populations who were omitted from the guidelines, obese patients being the largest omission (pun intended).

Dr. Ryback is on the panel currently revising these guidelines and he spoke about some of the changes the panel are considering. Most interesting to me was the (possible) recommendation to draw two post-dose serum levels following the loading dose.
first_dose_levels

To which I say a resounding yes. Considering the large interpatient variability in Vancomycin pk, why “guess” what a patient’s dosing requirements might be? Why wait 2-3 days to find out if your recommended dose is therapeutic or toxic? And then fiddle around for days with dose changes and more levels. With two levels following the loading you can nail down the patient’s vancomycin pk right off the bat. Home run.

Usually when I mention this as a solution to a younger pharmacist, I either get that “you’re crazy” look or a blank stare. Apparently these things have to come down from a mountain, carved into stone tablets. Or, at the very least, from someone with a half dozen initials behind their name. Sheep go to heaven, while goats go to hell (or at least exiled to the graveyard shift).

Regardless, this type of pk analysis is actually the original Sawchuck and Zaske method for gentamicin dosing, from 1977. All but forgotten except for a few devotees.

Kinetic model for gentamicin dosing with the use of individual patient parameters.

The “First dose 2- or 3-point” method of serum level analysis has been an option in all of my pk programs from the very beginning, some 30 years ago. Here’s a screen shot from the latest AbPK for Windows:
abpk_first_dose

I certainly hope this recommendation makes it to the new Vancomycin consensus document. Or, at least, it opens the eyes of some of the braver sheep.