
Users of rxkinetics.net have been contributing to a large data set for the past three years. The web app has been saving anonymous data from serum level analysis during this time. See this blog post: The BBVM project part II.
It is important to state up front that there is no quality control over this anonymous data. Some of it could have been entered incorrectly. Also there is no way to know how much is real patient data versus someone experimenting with the web app.
The other problem with this type of data collection is that many don’t “run the numbers” when the results are within target range. Therefore, outliers tend to become more prominent in the data set.
With those caveats in mind, let’s examine the data.
| All | BMI < 19 | BMI 19-30 | BMI > 30 | |
| Total | 2937 | 180 | 1808 | 939 |
| Male | 1686 | 89 | 1074 | 523 |
| Female | 1251 | 91 | 734 | 416 |
Let’s delve into the statistics from the two largest groups.
BMI 19-30
| Age | BMI | CrCl | Vd L/kg TBW | VD L/kg ABW | |
| Min | 15 | 19.04 | 8.0 | 0.38 | 0.38 |
| Max | 100 | 30.04 | 120 | 0.92 | 1.21 |
| Mean | 60.6 | 24.8 | 77.3 | 0.67 | 0.72 |
| Median | 63 | 24.6 | 72.0 | 0.69 | 0.73 |
| Mode | 65 | 23.2 | 120 | 0.70 | 0.70 |
| S.D. | 18.48 | 2.96 | 30.97 | 0.09 | 0.11 |
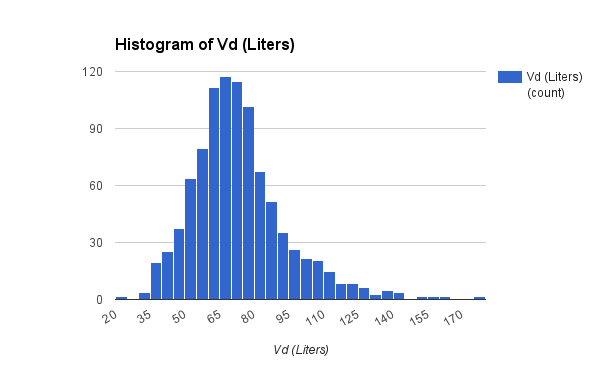
The raw Vd histogram follows a normal distribution (as a large sample should).

But the histogram for Vd L/kg total body weight (TBW) has a noticeable negative (left) skew.

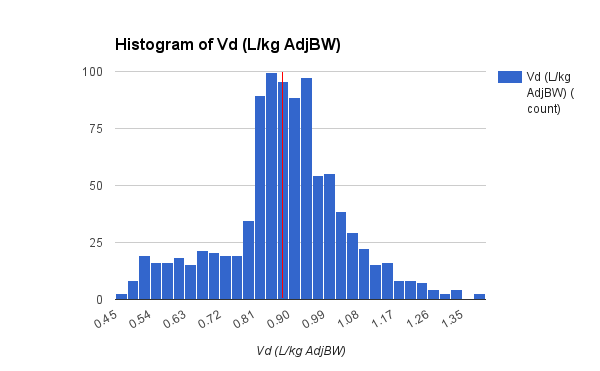
Because Vancomycin does not distribute well into adipose tissue let’s look at Vd L/kg of adjusted body weight (ABW), where ABW = LBW + 40% of the difference between TBW and LBW (i.e., the weight we used to dose Vancomycin “back in the old days”).

The histogram of Vd L/kg ABW is noticeably more normal than TBW (but not ideal).
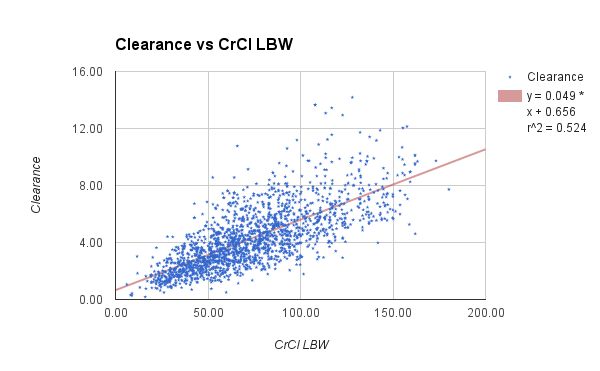
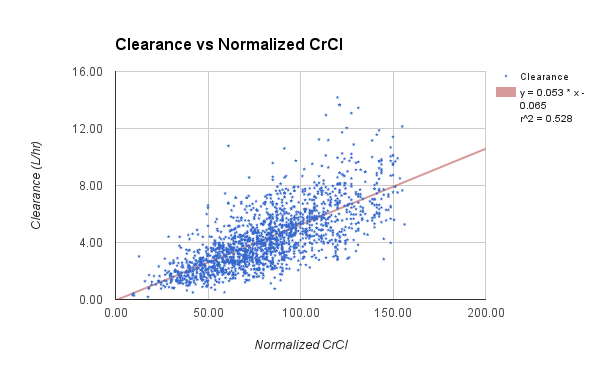
Regression of CL vs CrCl results in a higher r^2 value when we use Normalized CrCl vs LBW-based CrCl, 0.528 vs 0.524. (CrCl Methods explained)
BMI > 30
| Age | BMI | CrCl | Vd L/kg TBW | VD L/kg ABW | |
| Min | 17 | 30.1 | 10 | 0.37 | 0.45 |
| Max | 95 | 77.7 | 120 | 0.91 | 1.40 |
| Mean | 59.2 | 37.9 | 73.6 | 0.67 | 0.89 |
| Median | 60 | 35.4 | 71 | 0.69 | 0.89 |
| Mode | 57 | 32.4 | 120 | 0.70 | 0.59 |
| S.D. | 15.59 | 8.08 | 30.41 | 0.11 | 0.16 |
As with the previous group, in obese patients the histogram for Vd L/kg of ABW has a more normal distribution than TBW.

The r^2 improvement is even greater in obese patients when using normalized CrCl for the Kel regression, 0.533 vs 0.412.


Summary
Again, since the data is not verified this analysis is debatable. However it does pose a couple of questions:
- Should we use adjusted body weight when modeling Vancomycin volume of distribution?
- Should we use normalized creatinine clearance when modeling Vancomycin elimination rate?